Hi, Exabees, on this occasion we will discuss about "Server Monitoring in Windows Server 2012". What is Server Monitoring? Server Monitoring is the activity of monitoring a server in terms of hardware performance, software, traffic data, and many more.
1. Please login to the Task Manager. To open it is quite easy, just search and type "Task Manager".
2. If it has been opened, now try opening the application of your choice, but in this example I opened the Server Manager application and there will be changes in the Windows Task in the Task Manager application.
3. Now click "More Details" to view in detail.
4. In the Processes tab there will be a table of CPU and Memory usage, It also shows the applications that are running, both applications that are running or applications that are running on the back screen.
5. Then on the Performance Tab there are activities carried out by CPU, Memory and Network. The image below shows the process on our CPU. It shows the number of processes, up time, and also the clock speed of your processor.
6. There is also an activity view of our PC Memory. It shows how much Memory we have, how much Memory is used and more.
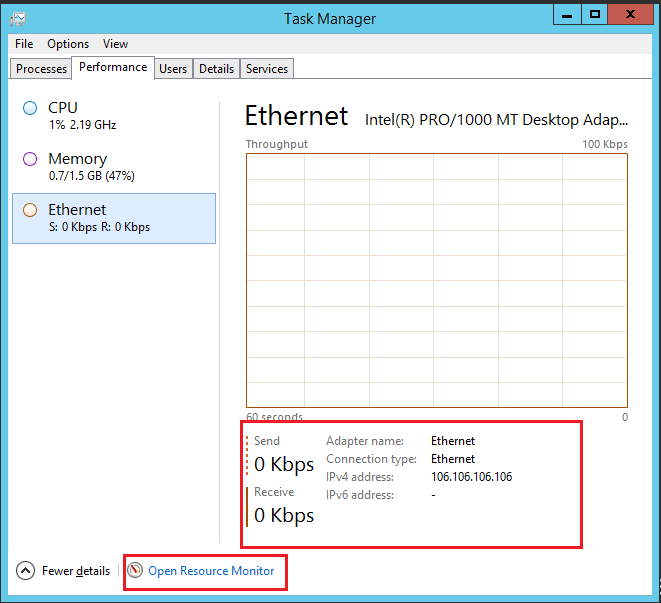
7. Then there is also Traffic Data from the network connected to our Server. There you can see the speed usage of Dowinload and Upload, how much our IP Address and the Adapter that our Server uses.
After that try clicking "Open Resouce Monitor".
8. Then the display will appear as shown below. Namely there are processes on CPU, Disk, Network and Memory, If we want to see the process in detail, we can click the "^" sign,
9. Here's how the process looks in detail.
Perfomance Monitor
1. To run the Perfomance Monitor application, we first open the server manager then click the menu on the Tools menu after that select Perfomance Monitor.
2. Then the Perfomance Monitor application will open, now in the Traffic Area after that click Add Counters.
3. Here I want to monitor the Processor, therefore click on the Processor menu after that click add, then click ok.
4. There will be a display of the processes that occur on our Processor Server.
Event Viewer
1. Now we try using the Event Viewer Application. Return to the Server Manager main page, then click on the Tools menu after that select Event Viewer.
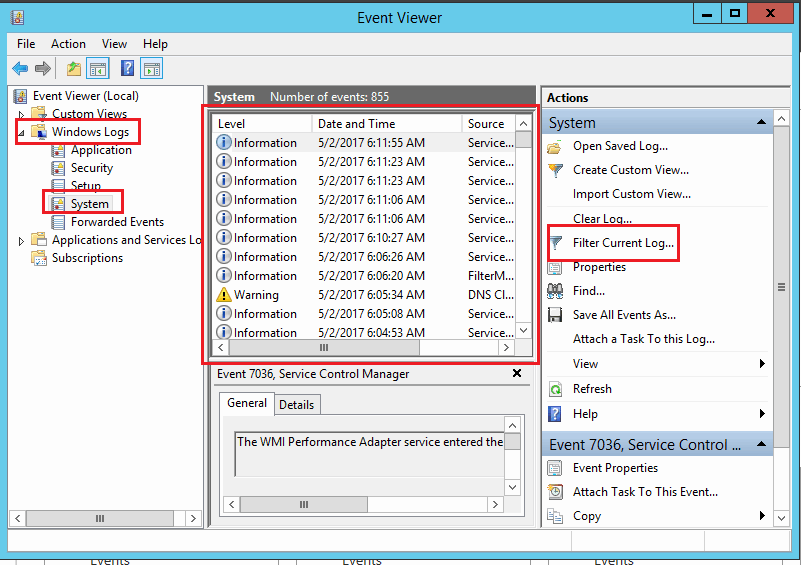
2. Click on windows logs, then select system, a filter of all logs on the system will appear. If you only want to display a few logs, you can click Filter Current Log.
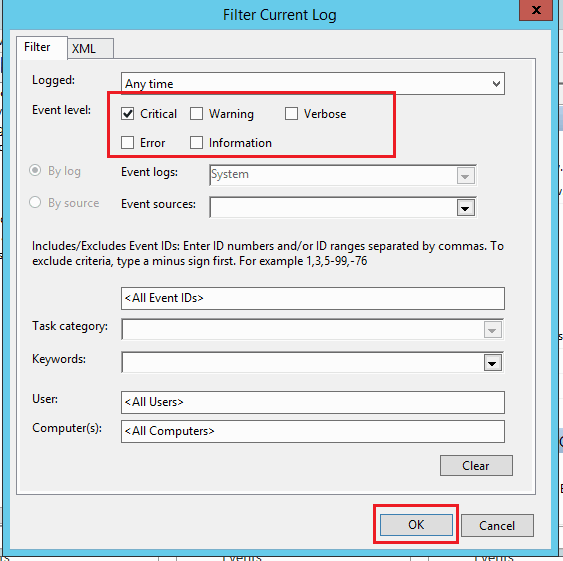
3. A window will appear as below, in this example I only want to display Critical logs, therefore give a check mark to the Critical section in the Event Level section, if so click ok.
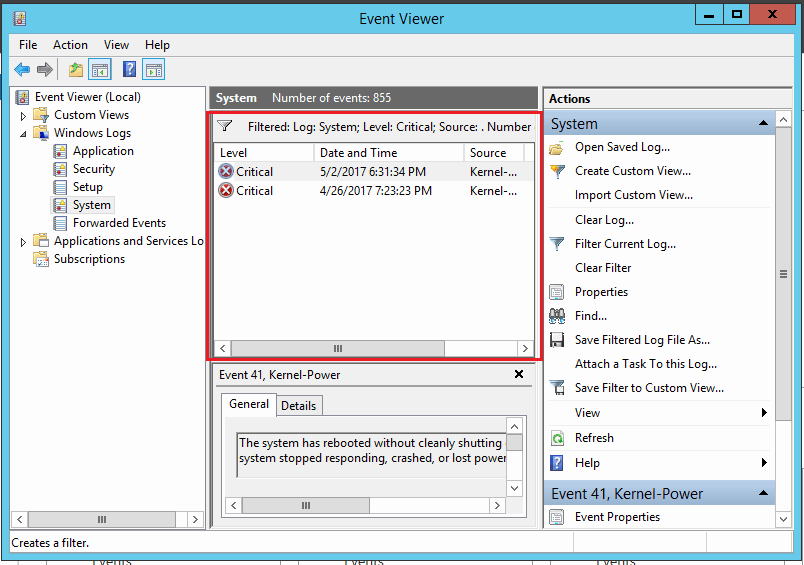
4. Here's what it looks like if only Log Critical appears.
Windows Healt Monitor
1. Now we try to use an external application, we have to download this application first. In this example I am using an application called Windows Health Monitor.
If you have downloaded the installer, we proceed to the installation. At the first stage click next.
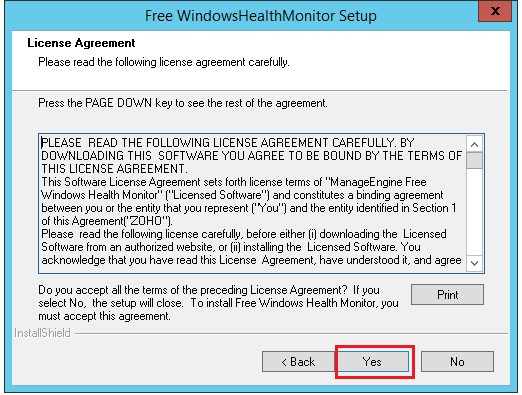
2. Here we are asked to approve the license, select yes.
3. Set the directory where this application will be installed, here I set the default directory.
4. Click next to start the installation.
5. Once the installation is complete, click finish.
6. Open and run the Sconfig command after that look at our computer name and domain server.
7. Open the Windows Health Monitor that we installed earlier. Then click Add Server, on the new pop up that opens. Fill in the Server name, domain, username and password of our server.
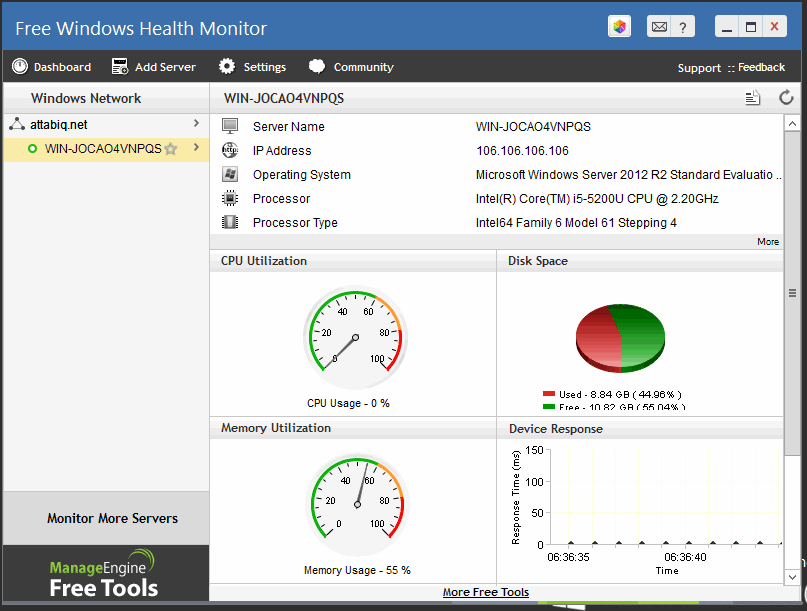
8. Here's a view of our server being monitored.
Thank you!